
Varying values of a, b,
and c
by:
Brandt Hacker
For
this assignment we will look at quadratic equations of the form ![]() and vary values
of a, b, and c while keeping the other two constant.
and vary values
of a, b, and c while keeping the other two constant.
Given the equation ![]() we will first look to
fix the variables a and b and attempt to generalize a rule for how the graph
behaves as we change the value of c.
The following is a set of graphs showing different values of c with
fixed values of a and b:
we will first look to
fix the variables a and b and attempt to generalize a rule for how the graph
behaves as we change the value of c.
The following is a set of graphs showing different values of c with
fixed values of a and b:
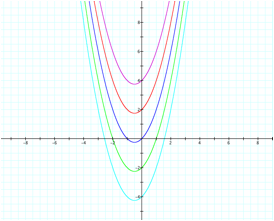
Just as changing
the value of the constant in the linear function causes the graph to shift vertically, the
same is true for changing the value of c, the constant, in a quadratic function. That is in fact what we see here. Let
us first look at the blue graph where c = 0. Here the y-intercept of the graph is located at the
origin. As the value of c changes
so does the y-intercept, causing the graph to shift vertically. If you think about what we are doing in
changing the value of c, we are either adding or subtracting a constant value
to y. This addition or subtraction
will in turn shift every value of y vertically based on what value of c we are
adding or subtracting to the rest of the function.
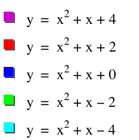
Next we will
look at how our graph changes as the value of b is changed in the quadratic
equation. Below is a picture
highlighting several different values of b as both a and c remain constant.
In analyzing the
graphs of the six equations listed above, it should first be noted that they
all have the constant -2. Based on
what we established in analyzing the changes in c, all six of the quadratic
equations go through one common point, (0,-2).
After analyzing the graphs we see that the six graphs appear to shift both vertically and horizontally. The largest value of b, the purple graph, gives us the graph that is shifted furthest left. The smallest value of b, the light blue graph, gives us the graph that is furthest right. By looking at the vertex of each of the six graphs it is quickly realized that the axis of symmetry for each graph is located on an integer value. After looking more closely we see that the axis of symmetry is always -½ the value of b. In other words our vertex will lie on the line x = -(b/2).
We will next see if this
pattern continues as we change the values of a.
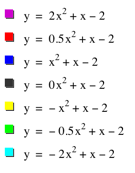
Next we will
look at how the graph changes as the value of a is changed in the quadratic
equation. Below is a picture
highlighting several different values of a as both b and c remain constant.
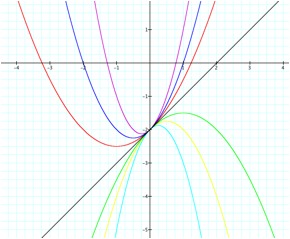
After examining
the six graphs above, one of the first things that should be noted is that our
assumption about the graph as the value of b changes does not appear to work in
all of the situations above. As a
changes it does not hold true that the axis of symmetry is located at -½ b. Instead it appears that each graph has an axis of symmetry
located at x = -½a.
As we continue
to examine the change in a, we see that all three graphs in which a is positive
have a graph which opens up while all three graphs in which a is negative has a
graph that opens down. Why would
this be? In multiplying the values
of a by a negative number we are taking the outputs of y and negating
them. This is what leads to the
reflected graph.
In addition to
this we see that as the value of a moves further from 0, the graph continues to
get thinner and thinner, it appears as though the graph is being
stretched. The opposite effect is
true for the graphs as the value of a moves closer to 0. Why does this occur? If we look at what happens when a = ½,
we are taking every ![]() value and
dividing by 2, this in turn causes every value of y to be closer to the vertex
than it would be had the value of a been left at 1. The opposite is true if we make the value of a greater than
1.
value and
dividing by 2, this in turn causes every value of y to be closer to the vertex
than it would be had the value of a been left at 1. The opposite is true if we make the value of a greater than
1.
Return to Hacker